
How many restaurants are in the US?
By Louis-Marie Giudicenti. Published . Updated . Data read .
There are 1,007,973 restaurants on Google Maps in the US as of November 9, 2026, one for every 337 residents. The Census counted 528,714 full-service and limited-service restaurants with paid employees in 2023, and 166,785 eating places with no employees in 2024.
- 1,007,973
- restaurants on Google Maps in the US
- 29.6
- per 10,000 residentsone for every 337
- 117,873
- in California, the most of any state
- 41.9
- per 10,000 residents in Hawaii, the most of any state
Source: Primavera’s database of Google Maps listings, snapshot 2026-11, read November 9, 2026. Population: Census 2024 estimates. See method.
Our count next to the Census and the official figures
Each source counts something different: Google Maps lists places, the Census counts businesses with or without paid staff, and federations count their members or their own definition. Here they are side by side.
| Source and what it counts | Year | Number |
|---|---|---|
| Primavera, Google Maps listings: restaurants open on the map, service points left out | 2026 | 1,007,973 |
| U.S. Census Bureau, County Business Patterns 2023: Full-service restaurants with paid employees (NAICS 722511) | 2023 | 258,626 |
| U.S. Census Bureau, County Business Patterns 2023: Limited-service restaurants with paid employees (NAICS 722513) | 2023 | 270,088 |
| U.S. Census Bureau, Nonemployer Statistics 2024: Restaurants and other eating places with no employees, coffee and snack bars included (NAICS 7225) | 2024 | 166,785 |
Primavera’s count is 1.9 times the Census count of establishments with paid employees (528,714 in 2023).
Sources: Census national files and federation pages read on November 4, 2026; Primavera, snapshot 2026-11.
Why the numbers differ
- Counters inside other businesses. Pizza and chicken counters in convenience stores have listings of their own: Hunt Brothers Pizza has 5,059 and Krispy Krunchy Chicken 4,673.
- What counts as a restaurant. This count includes cafeterias, school cafeterias and truck-stop restaurants. It leaves out bars, coffee shops and bakeries, which have counts of their own.
- Businesses, not places. Nonemployer Statistics count businesses that file taxes, a caterer as much as a food truck, whether or not they have a dining room on the map.
- Dates. The Census figures describe 2023 and 2024; this count, November 9, 2026.
Parts of this count have pages of their own: fast food restaurants, Chinese restaurants and Mexican restaurants.
Which state has the most restaurants?
California, with 117,873 listings, ahead of Texas (100,157). Per resident, the District of Columbia comes first (46.2 per 10,000 residents), then Hawaii (41.9), against 29.6 for the US.
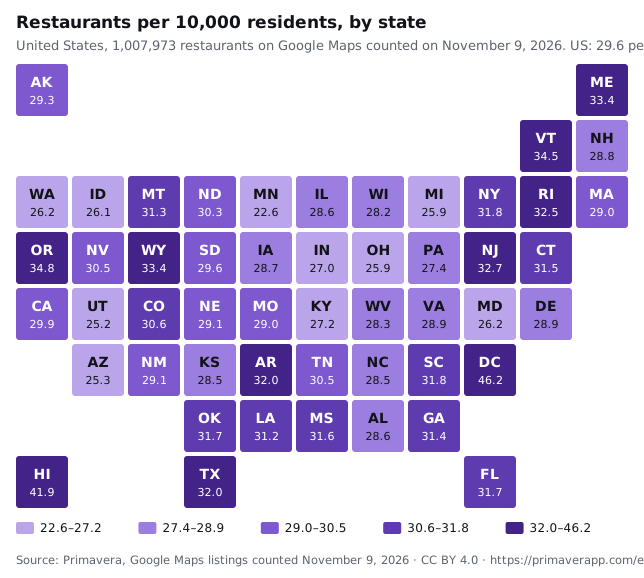
Restaurants per 10,000 residents, by state
Google Maps listings counted November 9, 2026. US: 29.6 per 10,000 residents.
- 22.6–27.2
- 27.4–28.9
- 29.0–30.5
- 30.6–31.8
- 32.0–46.2
Each square is a state, placed roughly where it is on a map. Darker means more per resident.
| # | State | Restaurants | Rank by number | Per 10,000 residents | vs US |
|---|---|---|---|---|---|
| 1 | District of Columbia | 3,244 | 45 | 46.2 | +16.6 |
| 2 | Hawaii | 6,063 | 37 | 41.9 | +12.3 |
| 3 | Oregon | 14,876 | 23 | 34.8 | +5.2 |
| 4 | Vermont | 2,238 | 49 | 34.5 | +4.9 |
| 5 | Wyoming | 1,961 | 51 | 33.4 | +3.8 |
| 6 | Maine | 4,688 | 41 | 33.4 | +3.8 |
| 7 | New Jersey | 31,098 | 9 | 32.7 | +3.1 |
| 8 | Rhode Island | 3,611 | 43 | 32.5 | +2.9 |
| 9 | Texas | 100,157 | 2 | 32.0 | +2.4 |
| 10 | Arkansas | 9,876 | 31 | 32.0 | +2.4 |
| 11 | South Carolina | 17,422 | 20 | 31.8 | +2.2 |
| 12 | New York | 63,089 | 4 | 31.8 | +2.2 |
| 13 | Florida | 74,194 | 3 | 31.7 | +2.1 |
| 14 | Oklahoma | 12,969 | 27 | 31.7 | +2.1 |
| 15 | Mississippi | 9,294 | 33 | 31.6 | +2.0 |
| 16 | Connecticut | 11,560 | 29 | 31.5 | +1.9 |
| 17 | Georgia | 35,137 | 7 | 31.4 | +1.8 |
| 18 | Montana | 3,557 | 44 | 31.3 | +1.7 |
| 19 | Louisiana | 14,325 | 25 | 31.2 | +1.6 |
| 20 | Colorado | 18,255 | 18 | 30.6 | +1.0 |
| 21 | Nevada | 9,982 | 30 | 30.5 | +0.9 |
| 22 | Tennessee | 22,009 | 13 | 30.5 | +0.9 |
| 23 | North Dakota | 2,414 | 48 | 30.3 | +0.7 |
| 24 | California | 117,873 | 1 | 29.9 | +0.3 |
| 25 | South Dakota | 2,733 | 47 | 29.6 | 0.0 |
| 26 | Alaska | 2,172 | 50 | 29.3 | −0.3 |
| 27 | New Mexico | 6,208 | 36 | 29.1 | −0.5 |
| 28 | Nebraska | 5,828 | 38 | 29.1 | −0.5 |
| 29 | Massachusetts | 20,706 | 15 | 29.0 | −0.6 |
| 30 | Missouri | 18,104 | 19 | 29.0 | −0.6 |
| 31 | Delaware | 3,045 | 46 | 28.9 | −0.7 |
| 32 | Virginia | 25,473 | 12 | 28.9 | −0.7 |
| 33 | New Hampshire | 4,060 | 42 | 28.8 | −0.8 |
| 34 | Iowa | 9,308 | 32 | 28.7 | −0.9 |
| 35 | Illinois | 36,367 | 5 | 28.6 | −1.0 |
| 36 | Alabama | 14,734 | 24 | 28.6 | −1.0 |
| 37 | North Carolina | 31,466 | 8 | 28.5 | −1.1 |
| 38 | Kansas | 8,461 | 35 | 28.5 | −1.1 |
| 39 | West Virginia | 5,002 | 40 | 28.3 | −1.3 |
| 40 | Wisconsin | 16,789 | 21 | 28.2 | −1.4 |
| 41 | Pennsylvania | 35,798 | 6 | 27.4 | −2.2 |
| 42 | Kentucky | 12,473 | 28 | 27.2 | −2.4 |
| 43 | Indiana | 18,703 | 17 | 27.0 | −2.6 |
| 44 | Washington | 20,871 | 14 | 26.2 | −3.4 |
| 45 | Maryland | 16,389 | 22 | 26.2 | −3.4 |
| 46 | Idaho | 5,231 | 39 | 26.1 | −3.5 |
| 47 | Ohio | 30,761 | 10 | 25.9 | −3.7 |
| 48 | Michigan | 26,234 | 11 | 25.9 | −3.7 |
| 49 | Arizona | 19,203 | 16 | 25.3 | −4.3 |
| 50 | Utah | 8,820 | 34 | 25.2 | −4.4 |
| 51 | Minnesota | 13,092 | 26 | 22.6 | −7.0 |
US: 29.6 per 10,000 residents
In number, California (117,873), Texas (100,157) and Florida (74,194) lead. Per resident, the District of Columbia has 2.0 times as many restaurants as Minnesota, the lowest.
Source: Primavera, snapshot 2026-11, read November 9, 2026. 50 restaurants without a public address could not be placed in a state and are only in the US total.
How restaurants show up online
Restaurants in the United States, by kind of contact listed
Share of all 1,007,973 listings.
| Measure | Restaurants | All US businesses |
|---|---|---|
| Websites read | 551,667 | 12,846,647 |
| Built with WordPress | 20.4% | 29.2% |
| Built with Wix | 6.0% | 7.1% |
| Built with Squarespace | 5.9% | 5.6% |
| Site links to Instagram | 38.6% | 35.1% |
| Site links to Facebook | 41.2% | 45.2% |
| Meta Pixel or other Meta script | 8.0% | 8.8% |
| Google Ads tag | 4.4% | 6.1% |
| Average Google rating | 4.20 | 4.44 |
| Rated under 4 stars | 24.5% | 17.4% |
| Median Google reviews | 235 | 11 |
| Part of a chain | 25.3% | 7.9% |
Restaurants collect far more reviews than other businesses: the median restaurant listing with reviews has 235, against 11 for all US businesses. 38.6% of their websites link to Instagram.
Note: Builders, links and tags are shares of the websites Primavera could read (551,667 for restaurants), social pages and booking platforms excluded. The Meta figure is an upper bound: Meta’s like buttons and chat load the same script as its ad pixel. Sites made with GoDaddy, Weebly or Duda are counted under none of these builders. Ratings: listings with at least one review.
Which chains have the most restaurants?
25.3% of restaurant listings belong to a chain our rules recognize. Subway has the most, with 23,200.
| Chain | Listings | Share of restaurants |
|---|---|---|
| Subway | 23,200 | 2.3% |
| McDonald’s | 14,193 | 1.4% |
| Taco Bell | 8,599 | 0.9% |
| Burger King | 7,790 | 0.8% |
| Wendy’s | 6,661 | 0.7% |
| Little Caesars | 4,718 | 0.5% |
| Chipotle | 4,063 | 0.4% |
Note: Counts are Google Maps listings, which can differ from a chain’s own store count. Dunkin’ is left out: most of its stores are listed as coffee shops.
To build a list of these restaurants with their contact details, see the restaurants email list.
What these figures don’t say
- How many restaurants opened or closed this year. This is the first monthly count; changes will be published from the next one.
- Seats, sales or staff. Every listing counts once, from a food counter to a banquet hall.
- Food trucks and caterers with no fixed place, which rarely have a restaurant listing.
- How many companies own these places. A company with several locations counts once per listing.
Questions
Are there really 1 million restaurants in the US?
On Google Maps, about that: 1,007,973 restaurant listings in Primavera’s count of November 9, 2026. The Census counted 528,714 restaurants with paid employees in 2023. The two do not count the same thing: one counts businesses with a payroll, the other every place listed as a restaurant.
Which state has the most restaurants?
California, with 117,873 listings, ahead of Texas (100,157). Per resident, the District of Columbia comes first (46.2 per 10,000 residents), then Hawaii (41.9), against 29.6 for the US.
How many restaurants are chains?
25.3% of US restaurant listings belong to a chain our rules recognize; the other 74.7% are independents or chains our rules do not tie together.
How many restaurants have a website?
70.8% link to one. Counting links to a social network or an ordering platform as no site of their own, 33.3% of restaurants have none.
Method and data
Snapshot 2026-11, read November 9, 2026- What is counted
- Open listings on Google Maps in the United States whose main Google category is one of the categories below, or whose main category is generic and another of its categories is: 1,007,973 listings, counted on October 29, 2026 and read on November 9, 2026. Service points (lockers, charging stations) are left out.
- Categories
- 461 Google Maps categories: Takeout restaurant, Thai restaurant, Belgian restaurant, Chueotang restaurant, Haute French restaurant, Chop bar, Seafood restaurant, Moroccan restaurant, North Eastern Indian restaurant, Lithuanian restaurant, Tonkatsu restaurant, Guizhou restaurant, Central Javanese restaurant, Marche restaurant, North Indian restaurant, Dutch restaurant and 445 others.
- Per resident
- Listings for 10,000 residents, with each state’s population from the Census 2024 estimates. States are ranked on the exact ratio.
- Official figures
- Census County Business Patterns 2023 and Nonemployer Statistics 2024, read in their national files on November 4, 2026; federation pages read the same day. Links are in the table above.
- Chains
- A listing belongs to a chain when its name starts with the chain’s name and its website matches. Agents or franchisees who put their own name first are not tied to the chain.
- Cite and download
- Louis-Marie Giudicenti (2026). “How many restaurants are in the US?” Primavera. Data: snapshot 2026-11, November 9, 2026. https://primaverapp.com/en/data/restaurants-in-the-us
Permanent link: https://primaverapp.com/en/data/restaurants-in-the-us
Download: states (CSV), map (SVG)
Free to reuse under the CC BY 4.0 license, with a link to this page.
More on how the database is built: all trade counts and how Primavera builds its data.
Written by Louis-Marie Giudicenti
Founder of Primavera. Primavera sells lists of local businesses built from the same database.
Published
Updated
Open the search
The restaurants search from this page, ready to open in Primavera. Narrow it to a state or a city once it is open:
- Target
- Restaurants
- Location
- United States
Free, no account needed. Contact details stay hidden until you create a list. 300 free credits when you sign up.